Conversational AI Visualisation: Enhancing Customer Confidence through Clarity This project was all about finding the best way to communicate the design and behaviour of a conversational AI to both the supplier and the customer.
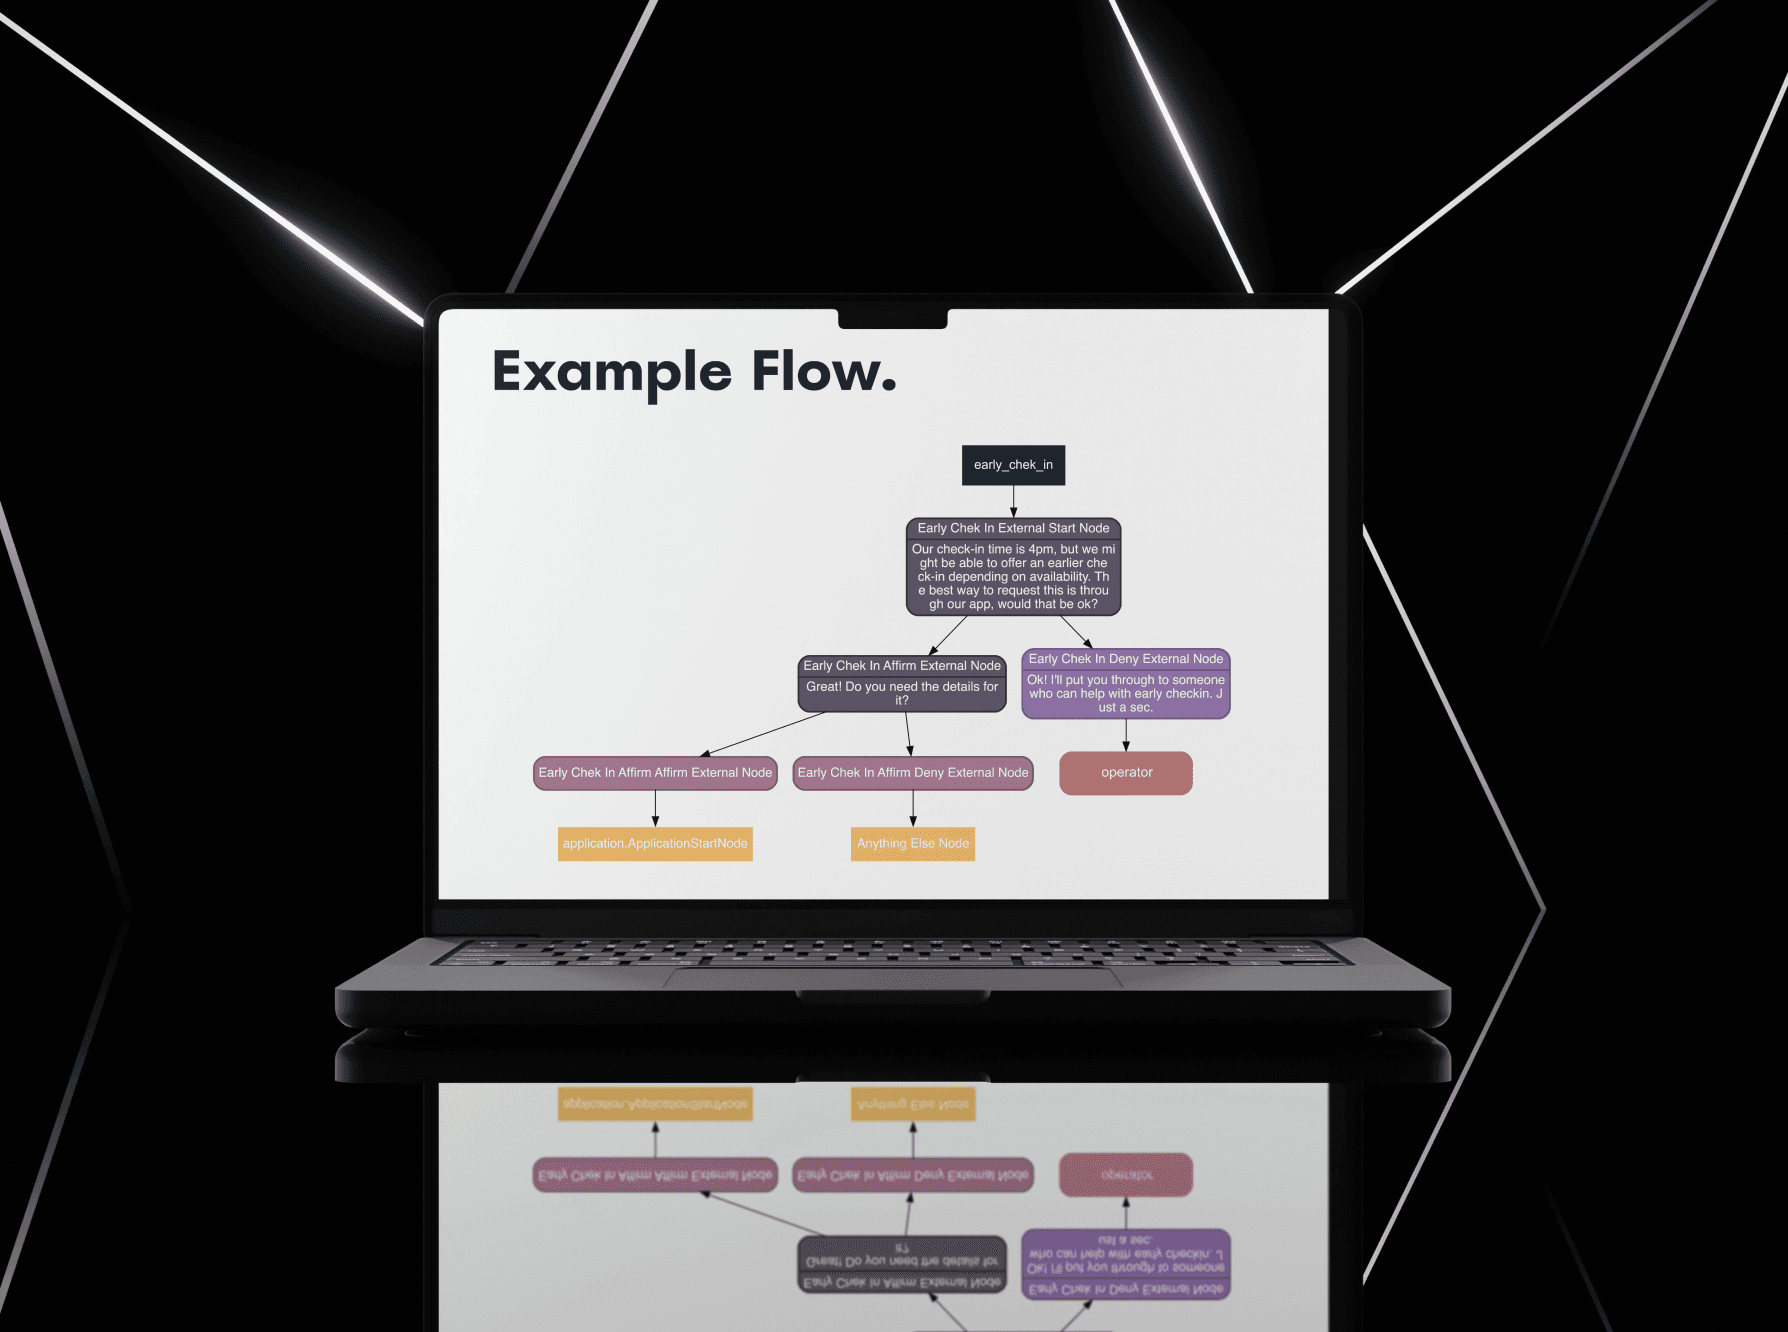
Working with Python, Django, and Graphviz, I developed a solution that transformed AI configuration data into graphical flow charts, making it easy for stakeholders to understand and interact with their virtual assistant.
The aim was to boost customer satisfaction in the hospitality industry by improving their visibility into the AI's decision-making process. By reducing response times and increasing transparency, this project has empowered customers with greater control over their AI solutions.
Engaging with stakeholders early on taught me that understanding their needs is crucial. Building a solution they can easily interpret boosts both its effectiveness and user adoption.
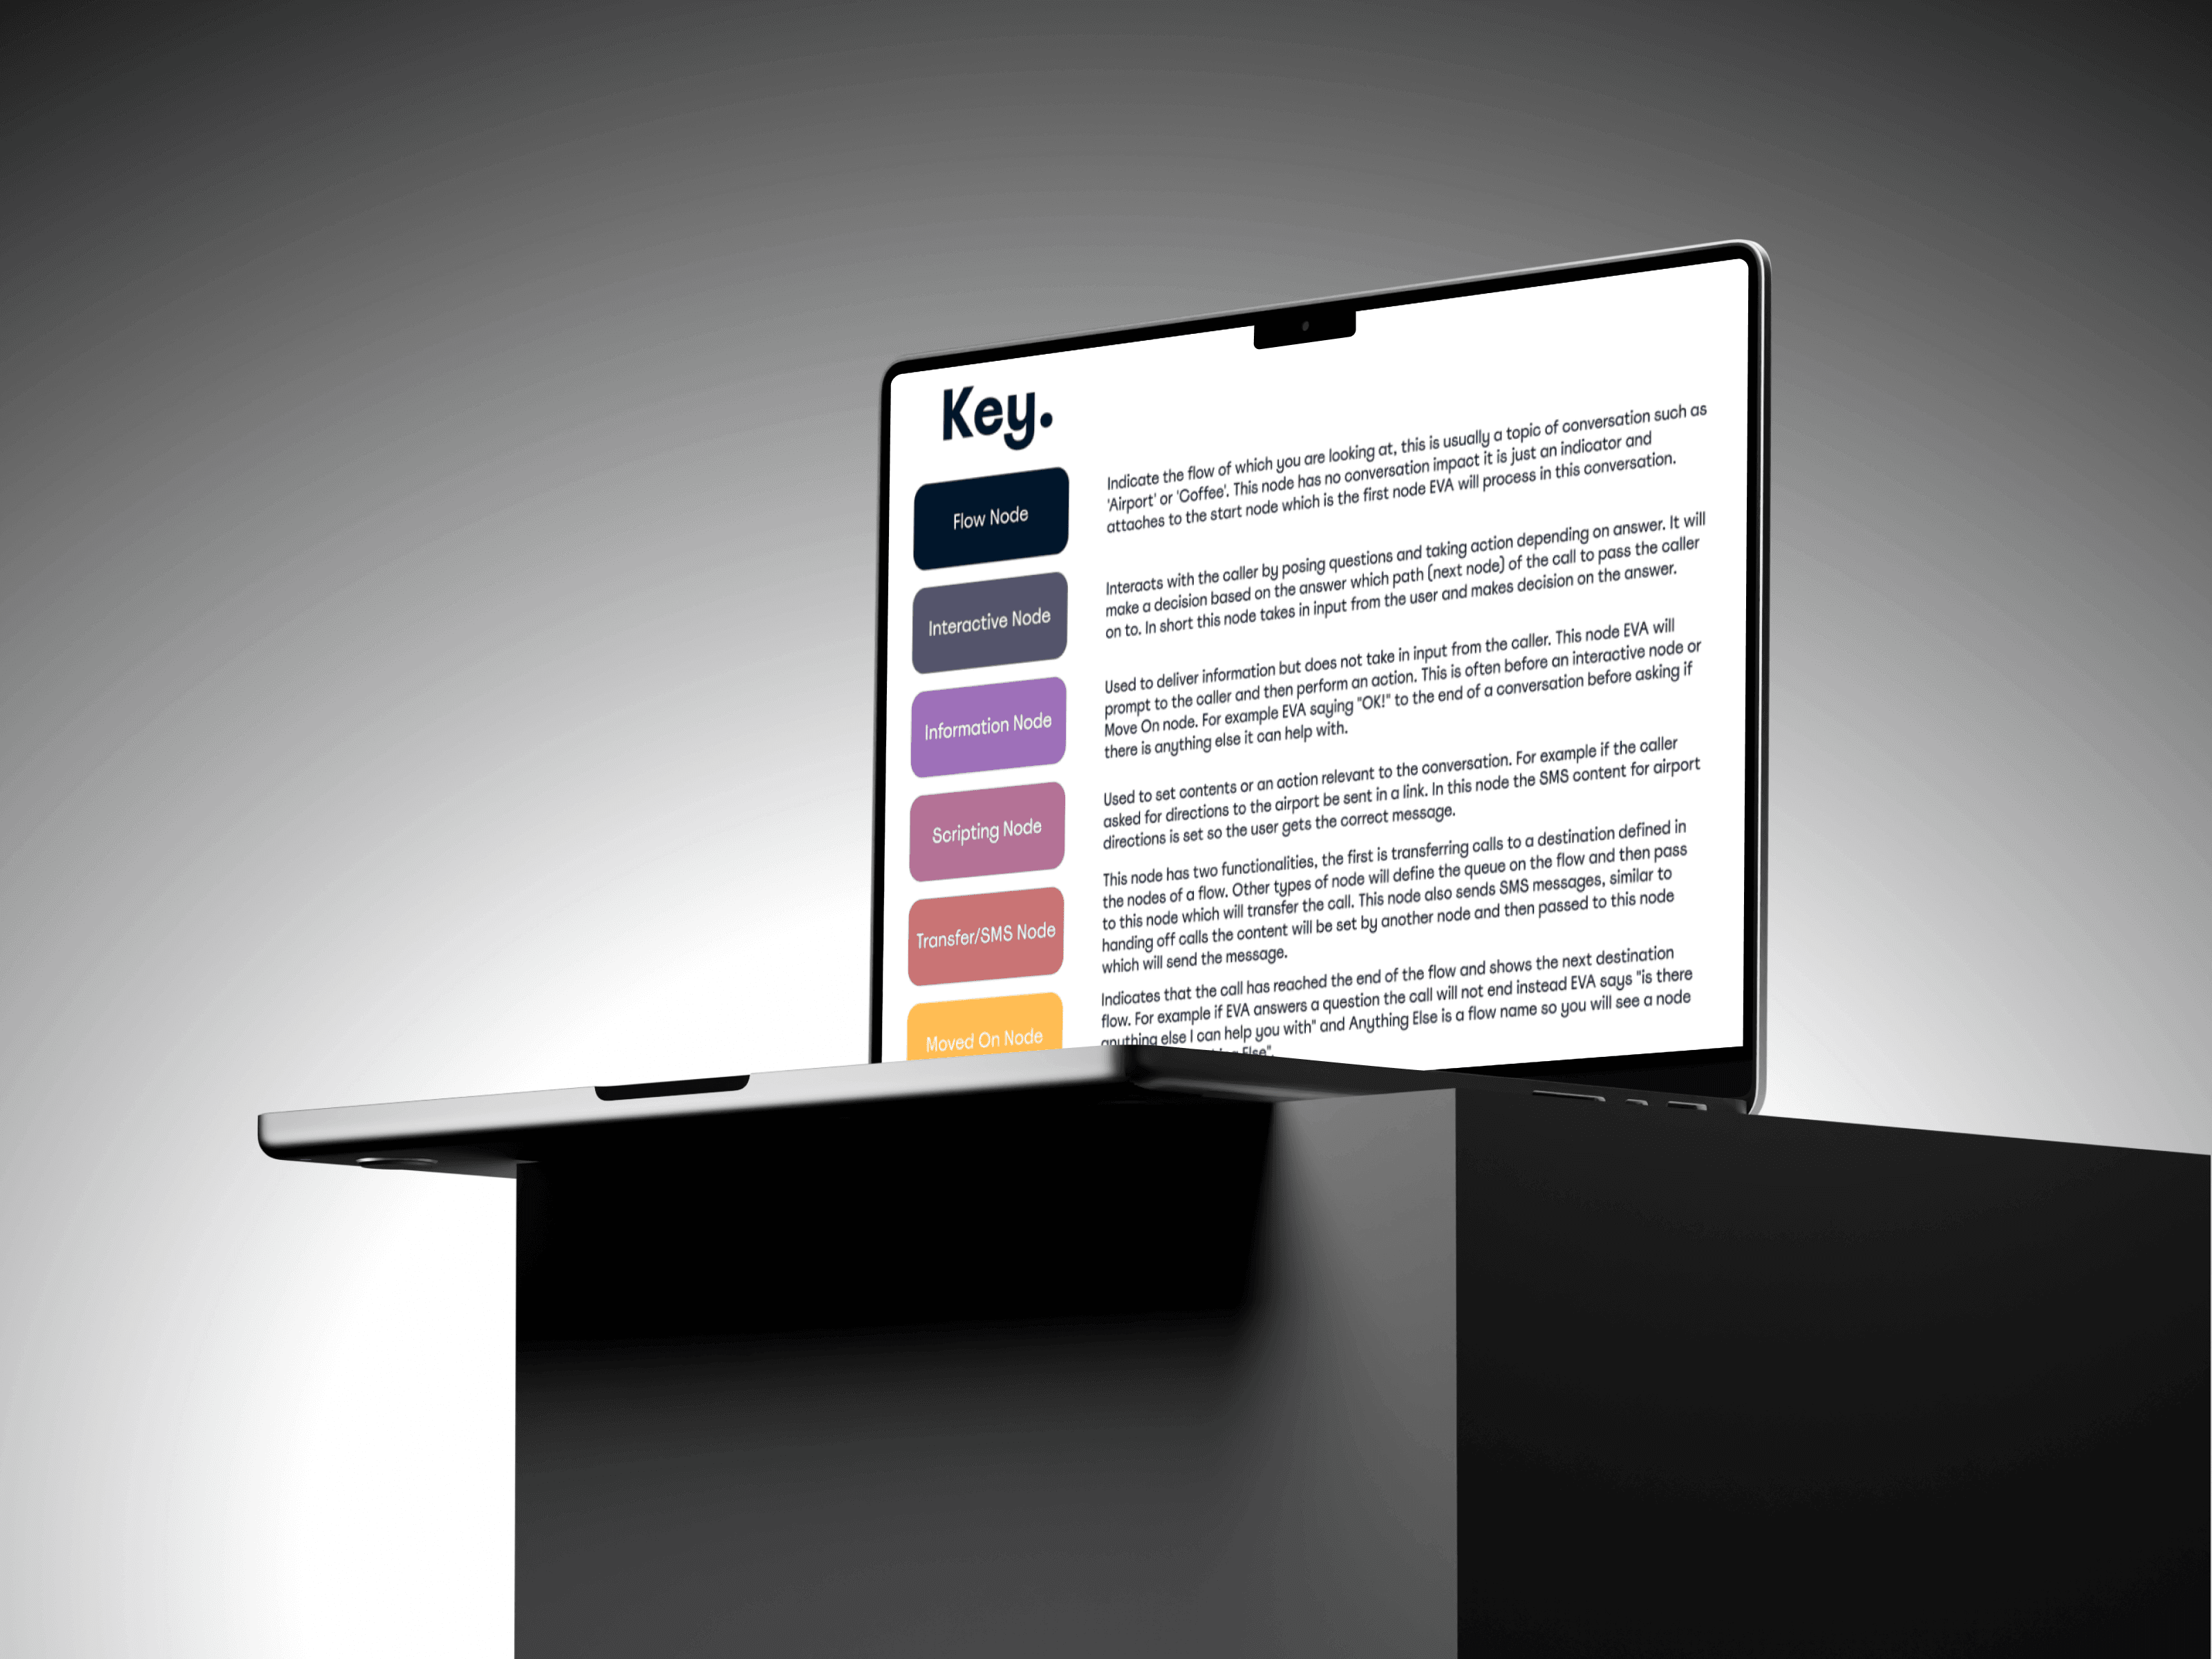
The heart of this project was to bridge the gap between AI data and its practical use in the hospitality sector. The program I developed not only automates data extraction but also converts complex bot behaviours into visual flow charts using Graphviz, making the AI's decision-making process transparent and accessible to non-technical users.
This graphical representation of AI logic has been integrated into a Django-powered web portal, allowing stakeholders to generate insights on demand. To explore the project further, you can find the code on GitHub and learn more about the company behind this innovation at Fourteen IP.
Not all data is the same—each type demands its own visualisation approach. Choosing the right way to present data is key to ensuring it’s both insightful and actionable.
Next Project
